| |

This report focuses on pelagic species catch volumes for reduction. This report analyses the activity on the market, the prices and stocks of fishmeal in South America and key markets. There is a special section for fish oil.
Fishmeal
Catches
Norway
Through week 49, they destined 634,9686 tonnes of fish for reduction at an average price of NOK 2.96/kg, down 12% on those destined for such purpose during the same period in the previous year.
Table 1: Catch volumes destined for fishmeal and fish oil production, Norway, 2018/2019, in tonnes
|
Species
|
Tonnes 2019
|
Tonnes 2018
|
Variation %
|
|
Herring
|
82,651
|
58,754
|
+41%
|
|
Blue whiting
|
351,220
|
454,249
|
-23%
|
|
Sandlance
|
10,180
|
14,584
|
-30%
|
|
Capelin
|
2
|
97,305
|
-100%
|
|
Small sandeel
|
124,509
|
68,548
|
+82%
|
|
Norway pout
|
58,356
|
23,925
|
+144%
|
|
Others
|
8,050
|
5,999
|
+34%
|
|
Total
|
634,968
|
723,364
|
-12%
|
Source: Norges Sildesalgslag
Prices and markets
China
At the beginning of week 50, inventories registered 189,000 tonnes. Volumes leaving the warehouses amounted to almost 21,000 tonnes during the preious week.
Table 2: Average price of fishmeal at the main Chinese ports 2019, in RMB/t
|
Quality
|
Price (RMB/t)
|
|
Week 49
|
Week 48
|
|
FAQ 65%
|
9,100
|
9,100
|
|
SD 68%
|
10,000
|
10,100
|
Source: FIS.com
Graph 1: Weekly average prices of fish meal FAQ in the main ports of China, 2015/2019, in RMB/t
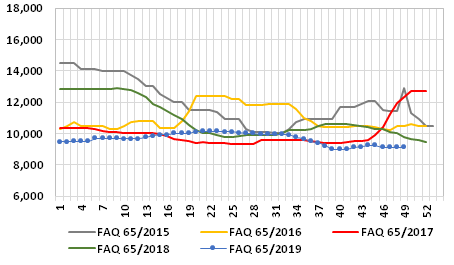
Source: FIS.com
Graph 2: Average weekly prices of SD fishmeal in the main ports of China, 2015/2019, in RMB/t
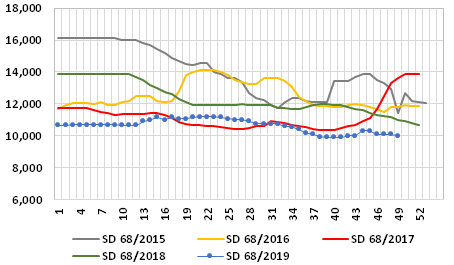
Source: FIS.com
Graph 3: Evolution of the weekly average prices of fishmeal in the main ports of China, 2015/2019, in RMB/t
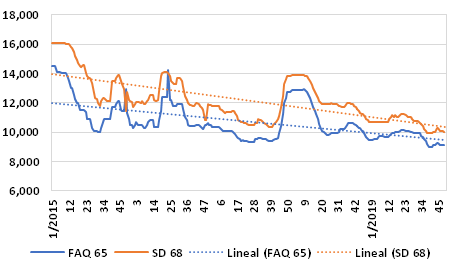
Source: FIS.com
Table 3: Price of white fishmeal, RMB/t, 2019
|
Quality
|
Origin
|
Price (RMB/t)
|
|
Week 49
|
Week 48
|
|
65-66%, produced on board
|
USA
|
13,300
|
13,300
|
|
58-60%,
|
Russia
|
10,500
|
10,500
|
Source: FIS.com
Peru
Catches have improved and are close to 900,000 tons (as of December 11), so there is a little more than 1 million left to complete the quota.
Table 4: Average prices of Peruvian fishmeal, in USD/t FOB, 2019
|
Quality
|
Average FOB price USD/t
|
|
Week 49
|
Week 48
|
|
SD 68/10/10/4(1)/120/7.5/500
|
1,350
|
1,330
|
|
SD 67/10/10/5(2)/120/10/1000
|
1,300
|
1,280
|
|
SD 67/10/10/5(2)/120/10
|
1,250
|
1,230
|
|
SD 67/10/10/5(2)/150/10
|
1,200
|
1,180
|
|
FAQ 66/12/10/5/2
|
1,150
|
1,130
|
|
FAQ 65
|
1,110
|
1,080
|
Source: FIS.com
Other origins
Chilean 67% fishmeal is at USD 1,520 and that produced in Iceland, 70%, at USD 1,575, both FOB Germany.
Back to Index
Fish oil
Peru
Raw fish oil is at USD 1,850/t.
Table 5: Prices of fishoil, Peru, 2019, in USD/t
|
Oil
|
Packaging
|
Incoterm
|
Week 49
|
Week 48
|
|
Fish oil, raw
|
Bulk
|
FOB PI Peru
|
1,850
|
1,850
|
|
Fish oil, raw
|
Barrels, FCL
|
FOB PI Peru
|
1,900
|
1,900
|
|
Fish oil, raw
|
Flexitank, FCL
|
FOB PI Peru
|
2,000
|
2,000
|
|
Fish oil, omega 3 guaranteed (28% EPA/DPA)
|
|
FOB PI Peru
|
2,200
|
2,200
|
Source: FIS.com
Back to Index
By DGA
www.fis.com
|


 Print
Print