|
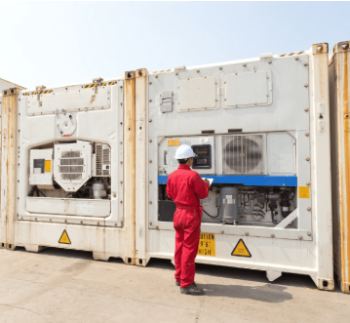
Photo: DHL Logistics
Japan's Agri-Food and Seafood Exports Rise 12.0% in July Driven by Yellowtail and Mackerel
 JAPAN
Thursday, September 03, 2026, 02:30 (GMT + 9)
The Ministry of Agriculture, Forestry and Fisheries of Japan (MAFF) reports total overseas shipments of 144.570 billion yen during the seventh month of the year, consolidating an 18.6% growth in the seafood sector so far in 2026.
Exports of food, agricultural, forestry, and seafood products from Japan registered a solid performance during the month of July 2026, reaching a total of 144.570 billion yen (US$ 905.3 million), representing an increase of 12.0% compared to the same month in 2025.
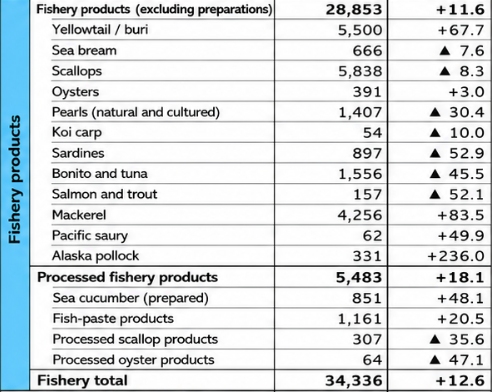
According to official statistics published by the Ministry of Agriculture, Forestry and Fisheries of Japan (MAFF), based on trade statistics from the Ministry of Finance of Japan, the seafood sector was one of the main drivers of this dynamism, accounting for shipments of 34.336 billion yen (US$ 215.0 million), a figure equivalent to a year-on-year expansion of 12.6%.
Breakdown by Sector in July 2026
During the month of July, the composition of exports reflected widespread increases across various agri-food categories:
.png)
Click on the image to enlarge it
According to official statistics published by the Ministry of Agriculture, Forestry and Fisheries of Japan (MAFF), based on trade statistics from the Ministry of Finance of Japan, the seafood sector was one of the main drivers of this dynamism, accounting for shipments of 34.336 billion yen (US$ 215.0 million), a figure equivalent to a year-on-year expansion of 12.6%.
Performance by Fish and Seafood Species
A detailed analysis by marine species reveals contrasting dynamics in Japanese foreign trade during July. Yellowtail / buri (Seriola quinqueradiata) and mackerel (Scomber japonica) experienced the largest absolute increases in value.
Conversely, products such as bonito and tuna (Thunnus spp. / Katsuwonus pelamis), sardine (Sardinops melanostictus), and salmon and trout (Oncorhynchus spp.) recorded significant contractions.
Cumulative Figures January to July 2026
In the first seven months of 2026, the cumulative value of Japan's agri-food and seafood exports amounted to 989.721 billion yen (US$ 6,197.4 million), representing a year-on-year growth of 11.4%.
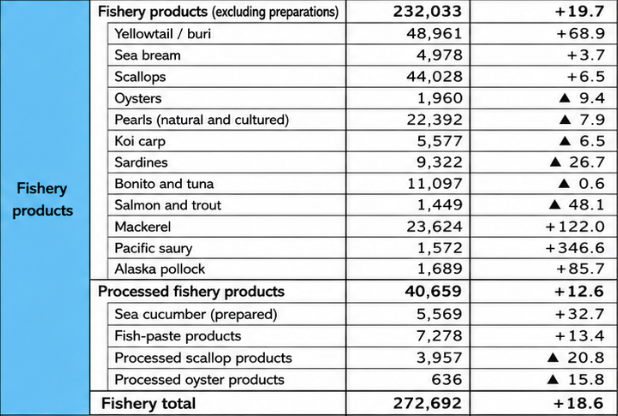
Meanwhile, the cumulative total for seafood products reached 272.692 billion yen (US$ 1,707.5 million), recording a remarkable expansion of 18.6% compared to the same period of the previous year.
Within unprocessed seafood products, which totaled 232.033 billion yen (US$ 1,452.9 million / +19.7%), the following cumulative results stood out:
Main Destination Markets
During the period between January and July 2026, the United States consolidated its position as the top destination for Japanese agri-food and seafood exports, followed by Hong Kong and China.
.png)
Click on the image to enlarge it
Monthly Evolution in 2026
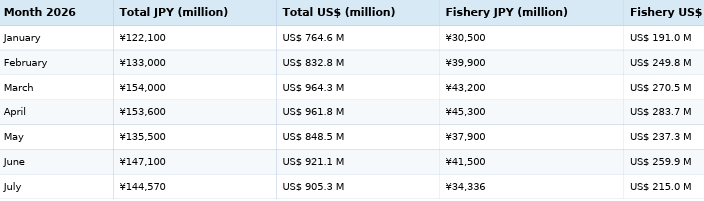
The monthly trajectory of total agri-food exports and the seafood sector during the current year shows the following evolution:
Click on the image to enlarge it
Methodological Criteria
Data reported by MAFF originates from official foreign trade statistics published by Japan Customs. Figures represent monetary values expressed in Japanese yen (JPY). Equivalent conversions to US dollars (US$) were calculated using an indicative spot exchange rate set by the Bank of Japan of 159.70 yen per dollar as of September 2, 2026.
🇯🇵 日本語 (Japanese Version) | AIによる自動翻訳
日本 7月の農林水産物・食品輸出額がブリやサバの牽引により12.0%増
農林水産省(MAFF)が発表した同月海外出荷額は1,445億7,000万円に達し、2026年累計の水産物輸出は前年同期比18.6%増と堅調な伸びを維持。
2026年7月における日本の農林水産物・食品の輸出額は、合計1,445億7,000万円(9億530万米ドル)に達し、2025年同月比で12.0%増と堅調な実績を記録しました。
財務省の貿易統計に基づき農林水産省(MAFF)が公表した公式統計によると、水産物部門はこの成長の主要な牽引役となり、輸出額は343億3,600万円(2億1,500万米ドル)を計上、前年同月比12.6%増の拡大を示しました。
2026年7月の部門別内訳
7月中の品目別構成では、農林水産物の各分野で広範な増加が確認されました。
-
農産物: 1,032億7,200万円(6億4,670万米ドル)、前年同月比11.9%増。
-
林産物: 69億6,200万円(4,360万米ドル)、同9.6%増。
-
水産物(加工品除く): 288億5,300万円(1億8,070万米ドル)、同11.6%増。
-
水産加工品: 54億8,300万円(3,430万米ドル)、同18.1%増。
魚種別動向
7月の日本における水産物輸出動向を魚種別に分析すると、明暗が分かれる結果となりました。ブリ(Seriola quinqueradiata)およびサバ(Scomber japonica)が金額ベースで最も大きな増加を記録しました。
一方で、カツオ・マグロ類(Thunnus spp. / Katsuwonus pelamis)、イワシ(Sardinops melanostictus)、サケ・マス類(Oncorhynchus spp.)などは大幅な減少を示しました。
-
ブリ: 55億円(3,440万米ドル)、67.7%増(+22億円)。
-
ホタテ貝: 58億3,800万円(3,660万米ドル)、8.3%減。
-
サバ: 42億5,500万円(2,660万米ドル)、83.5%増(+19億円)。
-
カツオ・マグロ類: 15億5,600万円(970万米ドル)、-45.5%(-13億円)。
-
イワシ: 8億9,700万円(560万米ドル)、-52.9%(-10億円)。
-
スケソウダラ: 3億3,100万円(210万米ドル)、236.0%増。
-
サケ・マス類: 1億5,700万円(100万米ドル)、-52.1%。
-
サンマ: 6,200万円(40万米ドル)、49.9%増。
2026年1月〜7月累計実績
2026年1月から7月までの日本の農林水産物・食品の累計輸出額は9,897億2,100万円(61億9,740万米ドル)に達し、前年同期比11.4%増となりました。
うち水産物の累計総額は2,726億9,200万円(17億750万米ドル)となり、前年同期比で18.6%増の著しい伸長を記録しました。
生鮮・冷凍等の水産物(加工品除く)の累計額は2,320億3,300万円(14億5,290万米ドル / +19.7%)で、主な魚種別の累計実績は以下の通りです。
-
ブリ: 489億6,100万円(3億660万米ドル)、+68.9%。
-
ホタテ貝: 440億2,800万円(2億7,570万米ドル)、+6.5%。
-
サバ: 236億2,400万円(1億4,790万米ドル)、+122.0%。
-
カツオ・マグロ類: 110億9,700万円(6,950万米ドル)、-0.6%。
-
イワシ: 93億2,200万円(5,840万米ドル)、-26.7%。
-
カキ: 19億6,000万円(1,230万米ドル)、-9.4%。
-
サンマ: 15億7,200万円(980万米ドル)、+346.6%。
-
サケ・マス類: 14億4,900万円(910万米ドル)、-48.1%。
-
水産加工品: 406億5,900万円(2億5,460万米ドル)、+12.6%。
主要輸出国・地域
2026年1月〜7月の期間において、米国が日本の農林水産物・食品の最大輸出先としての地位を維持し、次いで香港、中国となりました。
-
米国: 1,907億円(11億9,410万米ドル)、前年同期比+18.1%(7月単月の水産物輸出額: 78億円)。
-
香港: 1,261億円(7億8,960万米ドル)、+3.5%(7月水産物: 46億円)。
-
中国: 1,098億円(6億8,750万米ドル)、+5.3%(7月水産物: 4億円)。
-
台湾: 1,033億円(6億4,680万米ドル)、+9.6%(7月水産物: 29億円)。
-
韓国: 711億円(4億4,520万米ドル)、+20.7%(7月水産物: 23億円)。
-
ベトナム: 628億円(3億9,320万米ドル)、+32.1%(7月水産物: 43億円)。
-
タイ: 474億円(2億9,680万米ドル)、+11.6%(7月水産物: 33億円)。
2026年 月別推移
本年における農林水産物・食品全体および水産物部門の月別輸出額の推移は以下の通りです。
-
1月: 合計 1,221億円(7億6,460万米ドル) | 水産物 305億円(1億9,100万米ドル)。
-
2月: 合計 1,330億円(8億3,280万米ドル) | 水産物 399億円(2億4,980万米ドル)。
-
3月: 合計 1,540億円(9億6,430万米ドル) | 水産物 432億円(2億7,050万米ドル)。
-
4月: 合計 1,536億円(9億6,180万米ドル) | 水産物 453億円(2億8,370万米ドル)。
-
5月: 合計 1,355億円(8億4,850万米ドル) | 水産物 379億円(2億3,730万米ドル)。
-
6月: 合計 1,471億円(9億2,110万米ドル) | 水産物 415億円(2億5,990万米ドル)。
-
7月: 合計 1,445億7,000万円(9億530万米ドル) | 水産物 343億3,600万円(2億1,500万米ドル)。
統計上の基準
農林水産省が発表したデータは、日本税関(財務省)公表の貿易統計に基づいています。数値は日本円(JPY)建の金銭価値を示しています。米ドル(US$)への換算は、2026年9月2日時点の日本銀行公示スポット為替レート(1米ドル=159.70円)を適用して算出されています。
🇨🇳 中文 (Simplified Chinese Version) | 由人工智能自动翻译
中国 7月日本农林水产与食品出口额在黄条鰤和青花鱼带动下增长12.0%
日本农林水产省(MAFF)报告当月海外发货总额达1445.70亿日元,巩固了2026年至今水产品出口同比增长18.6%的势头。
2026年7月,日本的食品、农产品、林产品及水产品出口表现强劲,总额达到1445.70亿日元(9.053亿美元),较2025年同期增长12.0%。
根据日本农林水产省(MAFF)基于日本财务省海关贸易统计发布的官方数据,水产部门是这一增长的主要推动力之一,发货额达343.36亿日元(2.150亿美元),相当于同比扩张12.6%。
2026年7月按部门划分明细
7月期间,农林水产各领域的出口构成显示出普遍增长:
-
农业: 1032.72亿日元(6.467亿美元),同比增长11.9%。
-
林产品: 69.62亿日元(0.436亿美元),增长9.6%。
-
未加工水产品: 288.53亿日元(1.807亿美元),增长11.6%。
-
加工水产品: 54.83亿日元(0.343亿美元),反弹18.1%。
主要鱼类及海鲜品种表现
按海洋物种细分的详细分析显示,7月日本对外贸易呈现出分化态势。黄条鰤(Seriola quinqueradiata)和青花鱼(Scomber japonica)在价值上取得了最大的绝对增长。
相反,鰹鱼和金枪鱼(Thunnus spp. / Katsuwonus pelamis)、沙丁鱼(Sardinops melanostictus)以及鲑鱼和鳟鱼(Oncorhynchus spp.)等产品出现了显著萎缩。
-
黄条鰤: 55.00亿日元(0.344亿美元),增长67.7%(+22.00亿日元)。
-
扇贝: 58.38亿日元(0.366亿美元),下降8.3%。
-
青花鱼: 42.55亿日元(0.266亿美元),增长83.5%(+19.00亿日元)。
-
鰹鱼和金枪鱼: 15.56亿日元(0.097亿美元),调整为-45.5%(-13.00亿日元)。
-
沙丁鱼: 8.97亿日元(0.056亿美元),下跌-52.9%(-10.00亿日元)。
-
狭鳕: 3.31亿日元(0.021亿美元),增长236.0%。
-
鲑鱼和鳟鱼: 1.57亿日元(0.010亿美元),下跌-52.1%。
-
秋刀鱼: 0.62亿日元(0.004亿美元),增长49.9%。
2026年1月至7月累计数据
在2026年前七个月中,日本农林水产与食品出口累计总额达到9897.21亿日元(61.974亿美元),同比增长11.4%。
同时,水产品累计总额达到2726.92亿日元(17.075亿美元),与上年同期相比实现了18.6%的显著扩张。
在未加工水产品中(总计2320.33亿日元 / 14.529亿美元 / +19.7%),以下主要品种的累计结果较为突出:
-
黄条鰤: 489.61亿日元(3.066亿美元),+68.9%。
-
扇贝: 440.28亿日元(2.757亿美元),+6.5%。
-
青花鱼: 236.24亿日元(1.479亿美元),+122.0%。
-
鰹鱼和金枪鱼: 110.97亿日元(0.695亿美元),-0.6%。
-
沙丁鱼: 93.22亿日元(0.584亿美元),-26.7%。
-
牡蛎: 19.60亿日元(0.123亿美元),-9.4%。
-
秋刀鱼: 15.72亿日元(0.098亿美元),+346.6%。
-
鲑鱼和鳟鱼: 14.49亿日元(0.091亿美元),-48.1%。
-
加工水产品: 406.59亿日元(2.546亿美元),+12.6%。
主要出口目的地市场
在2026年1月至7月期间,美国巩固了其作为日本农林水产与食品最大出口目的地的地位,其次是中国香港和中国大陆。
-
美国: 1907.00亿日元(11.941亿美元),同比增长+18.1%(7月水产品发货额: 78.00亿日元)。
-
中国香港: 1261.00亿日元(7.896亿美元),+3.5%(7月水产品: 46.00亿日元)。
-
中国大陆: 1098.00亿日元(6.875亿美元),+5.3%(7月水产品: 4.00亿日元)。
-
中国台湾: 1033.00亿日元(6.468亿美元),+9.6%(7月水产品: 29.00亿日元)。
-
韩国: 711.00亿日元(4.452亿美元),+20.7%(7月水产品: 23.00亿日元)。
-
越南: 628.00亿日元(3.932亿美元),+32.1%(7月水产品: 43.00亿日元)。
-
泰国: 474.00亿日元(2.968亿美元),+11.6%(7月水产品: 33.00亿日元)。
2026年逐月演变
本年度农林水产总出口额及水产部门的逐月轨迹显示出以下演变:
-
1月: 总额 1221.00亿日元(7.646亿美元) | 水产品 305.00亿日元(1.910亿美元)。
-
2月: 总额 1330.00亿日元(8.328亿美元) | 水产品 399.00亿日元(2.498亿美元)。
-
3月: 总额 1540.00亿日元(9.643亿美元) | 水产品 432.00亿日元(2.705亿美元)。
-
4月: 总额 1536.00亿日元(9.618亿美元) | 水产品 453.00亿日元(2.837亿美元)。
-
5月: 总额 1355.00亿日元(8.485亿美元) | 水产品 379.00亿日元(2.373亿美元)。
-
6月: 总额 1471.00亿日元(9.211亿美元) | 水产品 415.00亿日元(2.599亿美元)。
-
7月: 总额 1445.70亿日元(9.053亿美元) | 水产品 343.36亿日元(2.150亿美元)。
方法论标准
MAFF报告的数据源自日本海关(财务省)发布的官方对外贸易统计。数据代表以日元(JPY)计价的金钱价值。换算为美元(US$)的等值是根据日本银行在2026年9月2日确定的即期参考汇率(1美元 = 159.70日元)计算得出的。
editorial@seafood.media
www.seafood.media
|
|




.png)
.png)
.png)
 Print